An Earned-Value Management cockpit: KPI tiles, the EVM S-curve, SPI / CPI gauges with a persisted trend, and per-WBS, cost and milestone detail.
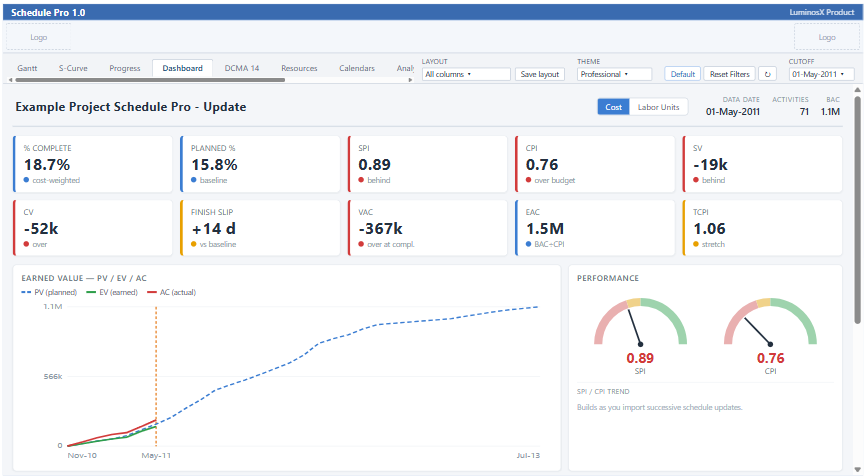
BAC, PV, EV, AC, SPI, CPI, EAC and VAC at a glance.
Cumulative planned, earned and actual value drawn to the cut-off.
Schedule and cost performance with a persisted period-over-period trend.
A performance table broken down by WBS branch.
A cost split donut and a milestone variance list.
Switch the whole cockpit between labor units and cost.
 Schedule Pro