A time-scaled, Primavera-style Gantt: a collapsible WBS grid beside a zoomable timeline of activity, baseline and milestone bars, with dependency logic, critical-path highlighting, and optional earned-value columns.
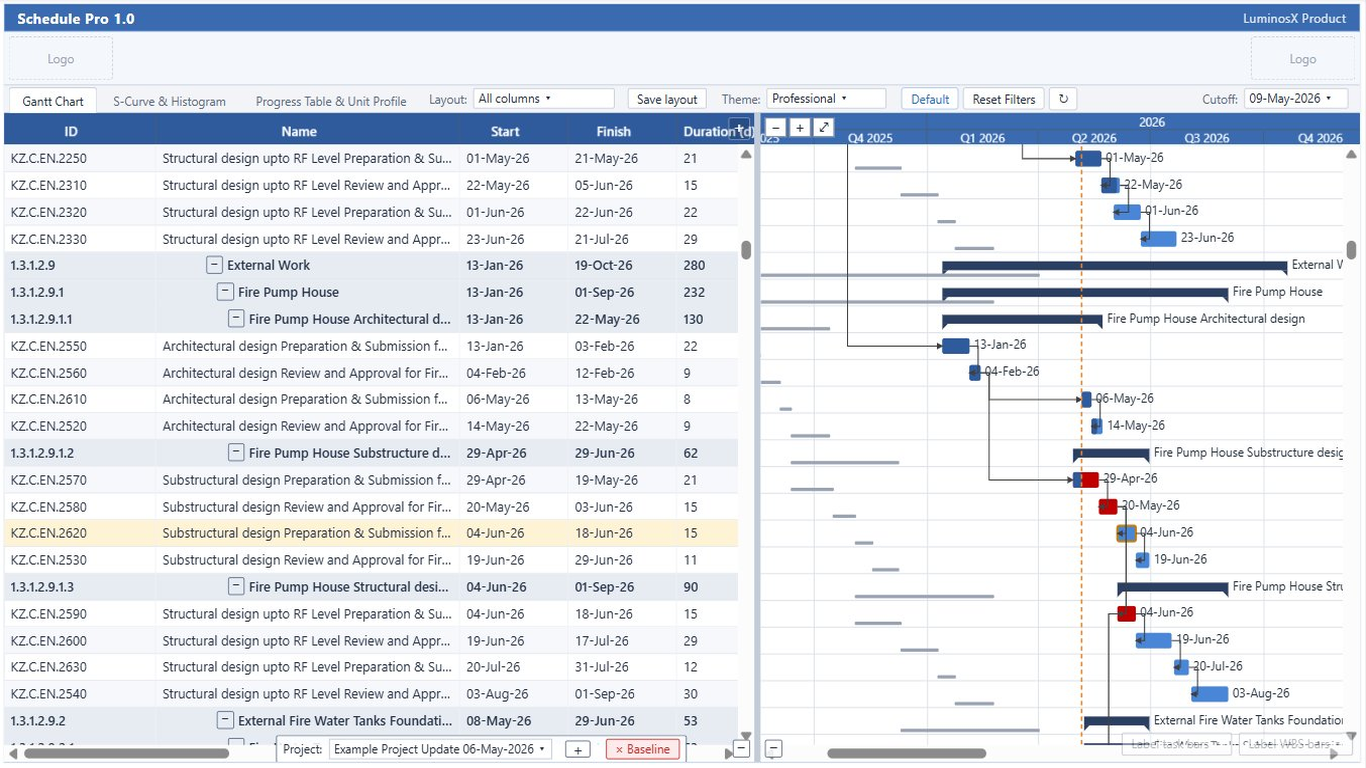
Expand or collapse the work-breakdown hierarchy, with resizable, reorderable columns and per-level row colors.
Activity, summary, milestone and baseline bars on a Day-to-Year zoom, with bar labels and weekend / non-working shading.
Finish-to-Start, Start-to-Start, Finish-to-Finish and Start-to-Finish arrows drawn from the imported relationship links.
Highlight the activities driving the finish - those with total float at or below a threshold.
A vertical marker at the cut-off makes planned-versus-actual obvious at a glance.
Add Schedule Complete %, Planned Cost (PV), Earned Cost (EV) and labor / cost complete to the grid.
 Schedule Pro