Schedule Pro logo Schedule Pro

Progress Table & Unit/Cost Profile

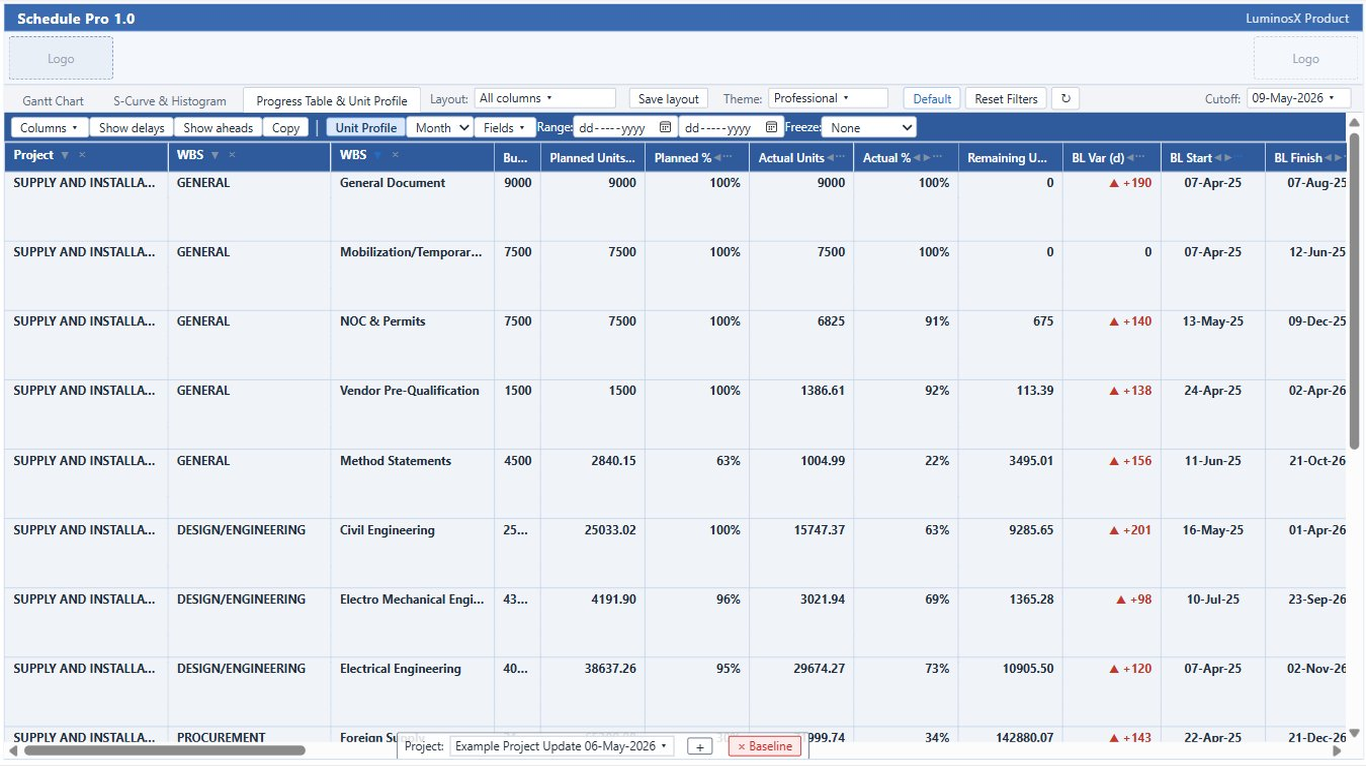
A tabular progress roll-up by WBS tier, with subtotals, variance icons and per-metric formatting - plus an optional time-phased unit / cost profile strip.
📘 Get Manual

See it in action

Schedule Pro progress table with planned and actual progress by WBS level in Power BI

Abilities & formatting

Roll-up by WBS tier

Child activity values roll up into the chosen WBS depth; the project tier is always depth 0.

How: choose which hierarchy level feeds each column.

Subtotal rows

Each WBS branch carries its own cut-off-aware subtotal.

How: subtotals compute automatically per level against the cut-off.

Variance ▲ / ▼ icons

Current versus baseline dates and quantities, shown as ahead / behind arrows.

How: enable the variance columns; arrow direction shows ahead (▲) or behind (▼).

% complete columns

The same labor-unit and cost bases used by the Gantt grid.

How: Units = labor only; Cost = all types.

Per-metric formatting

Number formats, decimals and styling set per column for report-ready output.

How: Format ▸ Progress Table ▸ per-column.

Unit / Cost profile

A period-by-period budget-versus-actual strip beneath each row.

How: toggle the profile and choose units or cost.