Schedule Pro logo Schedule Pro

Stress Risk Analysis

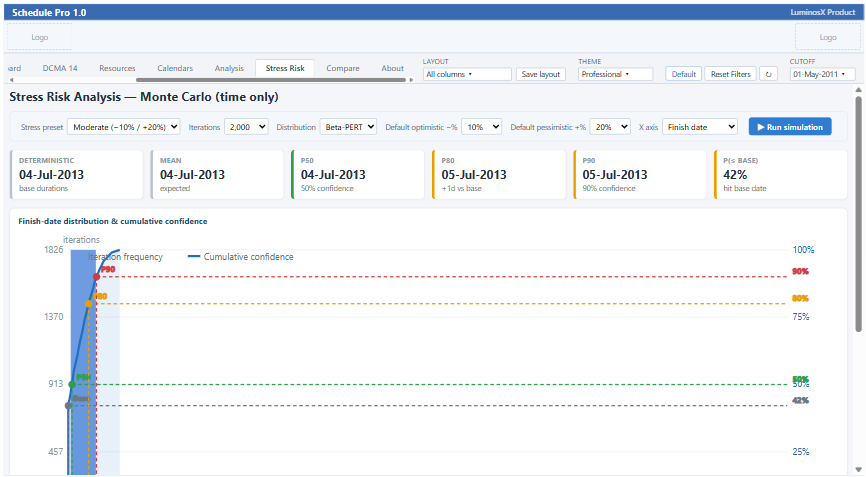
A schedule-only Monte Carlo simulation: it samples each activity's duration between optimistic and pessimistic bounds, runs the logic network thousands of times, and reports finish-date confidence.
📘 Get Manual

See it in action

Schedule Pro Stress Risk Analysis tab in Power BI

Abilities & formatting

Optimistic / pessimistic bounds

Per-activity - % and + % durations, or project-wide defaults.

How: set in the Gantt's Optimistic / Pessimistic Duration columns, or the tab defaults.

Beta-PERT or Triangular

Choose the sampling distribution and 1k-10k iterations.

How: the tab's simulation settings.

Finish-date histogram

The spread of simulated project finish dates.

How: project finish = the latest activity finish in each run.

P50 / P80 / P90 confidence

A cumulative confidence S-curve with P-markers and the base-finish marker.

How: the date by which 80% / 90% of runs complete.

Criticality index

How often each activity drives the project finish.

How: % of iterations in which the activity is the finish driver.

Probability versus base

The share of runs finishing on or before the deterministic finish.

How: compared to the base-duration finish date.